Before you begin exploring the OBIS-SEAMAP web site
The OBIS-SEAMAP web site provides a variety of tools to explore, map and download survey data for marine mammals, seabirds, sea turtles and sharks & rays collected from data providers across the globe.
You don't need an account to access the web site. However, use of the data available through the OBIS-SEAMAP web site is subject to the OBIS-SEAMAP Terms of Use and the sharing policy differs dataset by dataset. For those datasets with CC-BY-NC or CC-BY sharing policy, you can download the data from OBIS-SEAMAP web site immediately. There are datasets that require permission to download. Those data are not downloadable from the OBIS-SEAMAP web site unless users get permission from the data provider.
How to get more help
Before continuing reading this help, first be familiar with how to get more help. Each of the query tools and features in the online mapping tool has detailed help which you can view by clicking ![]() .
.
Quick Search
If you know your species or datasets of interest, the Quick Search at the main banner on the front page gives you the quickest way to find a set data or dataset that you are looking for. The Quick Search box accepts the following names or words and returns the matched species or dataset. It is equipped with live search functionality that dynamically searches the database as you type in (the live search is enabled at three letters or longer).
- Species scientific or common name at any level of taxonomic hierarchy (e.g. mammalia, or humpback whale)
- Species ITIS taxonomic serial number (e.g. 180530 for the humpback whale)
- Dataset name
- Dataset ID if you know
- Contributor name (institution or individual)
The Quick Search returns the matched items with the headline of the category such as 'Contributor found', 'Species found', 'Datasets found', 'Datasets from Matched Providers', so you know what kind of data are found in the OBIS-SEAMAP database. By clicking the dataset, species or contributor you are interested in, you are forwarded to the Advanced Mapping Tool, Dataset Page or Species Profile Page depending on what data you chose.
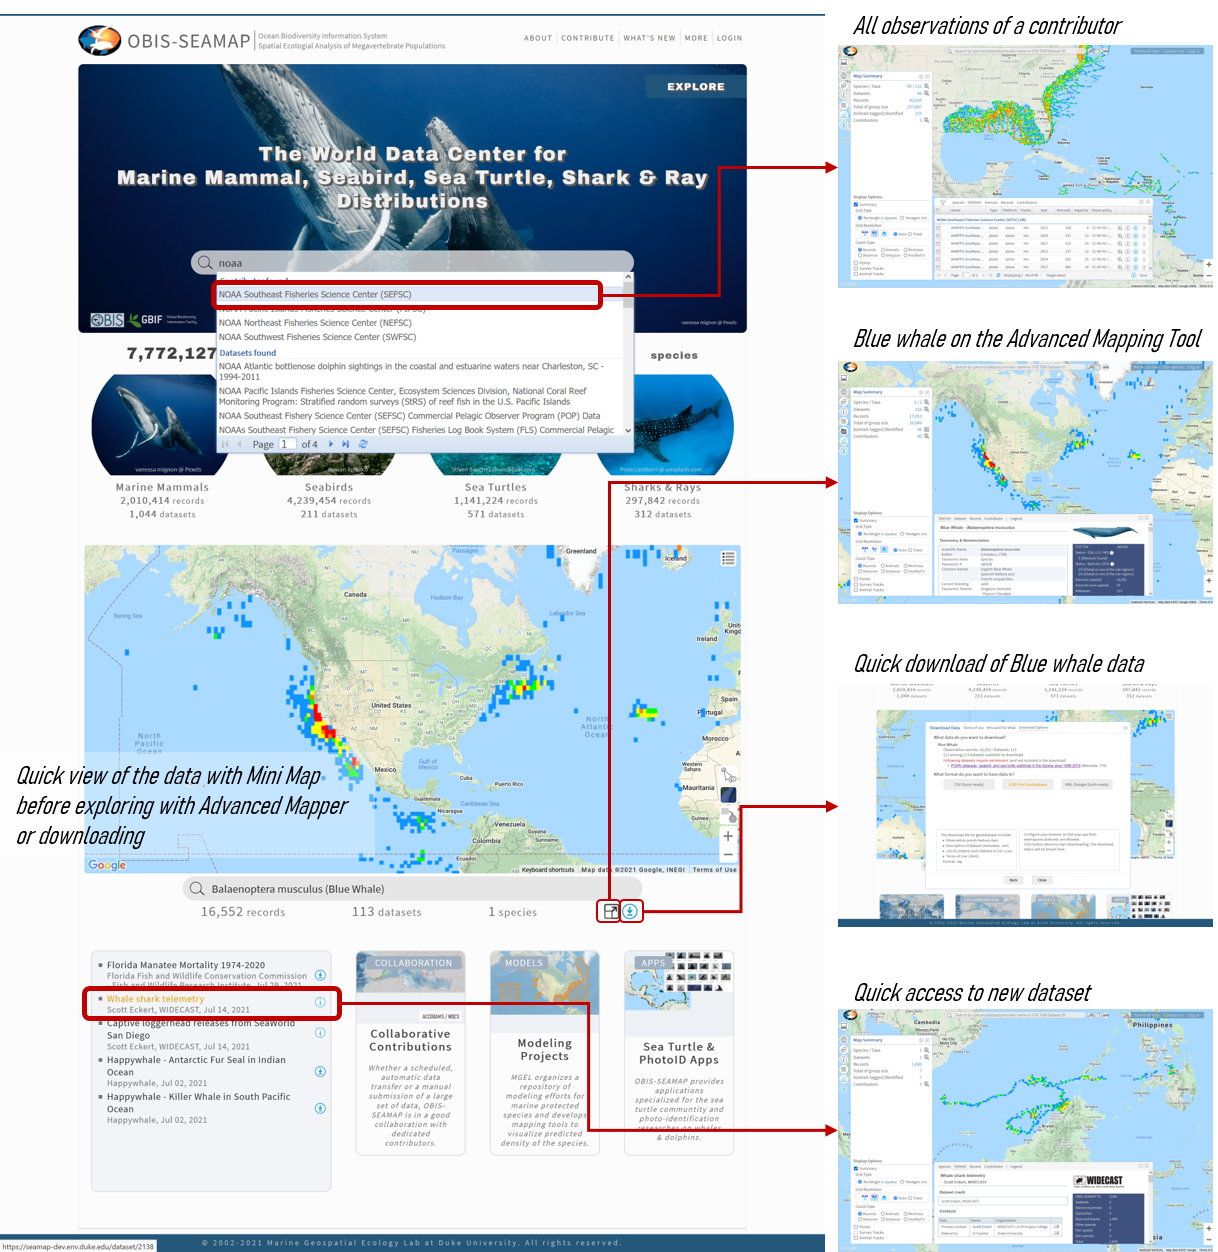
If you want to see a quick overview of a dataset before exploring in depth or just want to download it without going to the Advanced Mapping Tool, there is a Mini Map on the front page. The Search functionality is the same as the one in the banner but instead of taking you to the species or dataset page, the Mini Map shows the data that you chose along with the summary statistics. Along with the stats, there are two icons that appear where the left one takes you to the Advanced Mapping Tool with the data you chose pre-loaded and the right one allows you to quickly download the data.
In addition, there is a flipping card for new or updated datasets where you see a list of new / updated datasets whose links forward you to the Dataset Page. The list also includes an download icon per dataset.
| Icon | Description |
|---|---|
Show / hide the legend at the top of the map. | |
Switch the background image between satellite and terrain. | |
Switch the grid type between rectangle and hexagon. | |
Direct link to the advanced mapping tool with the selected data pre-loaded | |
Download the data. A download wizard, a series of popup window where you read the Terms of Use and enter your information, starts. |
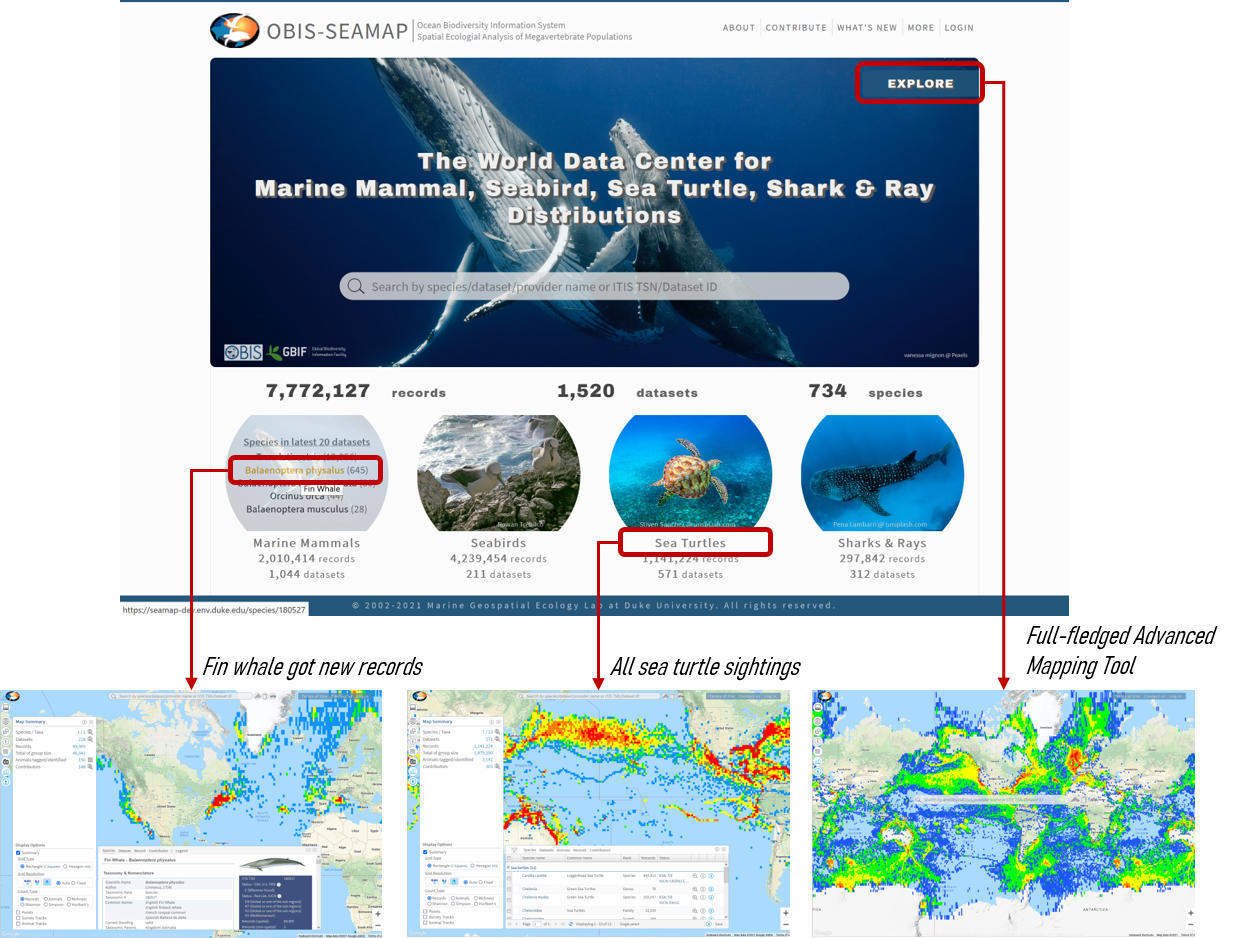
There are other convenient links on the Front Page. The four taxon groups are placed below the banner with the summary statistics. You can click the taxon group label to go to the Advanced Mapping Tool with all the observation of that taxon group pre-loaded. Also, when you move your mouse over one of the taxon groups, it will show you the species that got new records recently and you can click one of the species to jump to the Advanced Mapping Tool.
Overview of the Online Mapping Tools
There are three variations of the Online Mapping Tools that have different URLs with slightly different usage and functionality.
Advanced Search
The Advanced Mapping Tools (Advanced Search) builds the foundation of the data exploratory tools for the OBIS-SEAMAP data. The other two variations function as particular cases depending on your interest and are described below.
You can directly go to the Advanced Search with the URL or click [EXPLORE] button at the upper right corner of the Front Page banner. By default, the Advanced Search Interface loads the gridded summary of the entire holding of the OBIS-SEAMAP data.

At the center of the Advanced Search or Mapping Tool is the Quick Search box, which works the same way as on the Front Page. The only difference is that when you choose a species or dataset, it is added as a criterion to the Mapping Tool and the data on the map is filtered by the selection.
There are also three icons right to the Quick Search box, each of which brings up an organized data search panel.
| Icon | Description |
|---|---|
|
Species Search Panel organizes the available species through the texnomoic tree starting at the class (i.e. Aves, Chondrichthyes, Mammalia, Reptilia). You can go into branches and find taxa that belong to the branch. Alternatively, you can enter species name, scientific or common, into the search box which will list the matched names. A selection of one of the matched names brings you to the item within the corresponding branch. Then, click / select the species to add it to the selection of data on the mapper. If you just want to download the data of the species quickly, click the download icon Click 
|
|
|
Dataset Search Panel lists the datasets per contributor. If you are looking for datasets that observed your species of interest, enter the species name into the species search box. Once you have found the dataset you are interested in, click / select the dataset name to add it to the selection of data on the mapper. If you just want to download the data of the dataset quickly, you can start the download process by clicking the download icon Click Click 
|
|
|
If you are interested in a particular contributor and want to see its contributions, Contributor Search Panel will help you find your contributor of interest. The Panel lists all contributors ordered by person's last name by default. If you rather want to explore by organization name, choose [Organization] for "List per". Once you have found the contributor you are interested in, click / select contributor to add it to the the selection of the data to the mapper. Click 
|
Icon Tray
At the left side of the window is an icon tray that gathers all functionality of the Mapping Tool.
| Function | Description | |
|---|---|---|
| Toolbar | Show / hide the toolbar for the map navigation and operations including:
|
|
| Map Summary | Show / hide the panel that shows summary statistics of the current map. The Map Summary Panel also provides Display Options that allows you to turn on/off layers. See the popup help within the Mapping Tool for more details. |
|
| Layer Choices and Options | Show / hide the panel that lists available layers including Species Range Map and jurisdictional or biogeographic zoning layers and oceanographic layers. See the popup help within the Mapping Tool for more details. | |
| Information / Metadata | Open / close the Information Panel. The Information Panel has sub panels that show species profile, dataset metadata, record data, contributor information and legend. | |
| Legends | Open / close the Legends Panel, which is a sub panel of the Information Panel. The Legends Panel can be positioned at the right side of the Information Panel while you take a look at other information (e.g. Dataset Metadata) by clicking the icon |
|
| Charts | Open / close the Charts Panel that displays temporal changes of the observations currently on the map. Charts can overlay oceanographic variables such as sea surface temperature (SST) or chlorophyll-a. See the popup help within the Mapping Tool for more details. |
|
| Download | Start the download wizard that has three steps to request data download including:
|
URL parameters
To facilitate more flelxble, direct access to the data, the Advanced Search also accepts URL parameters that help you get the map of your interest quickly. The following table shows available parameters.
| Type | Key | Value | Multiple? |
Examples and notes |
|---|---|---|---|---|
| Species | sp_tsn | ITIS Taxonomic Serial Number (TSN) |
YES |
Multiple TSNs can be specified with comma as a separator. e.g. Sightings of Humpback whale and Blue whale |
| species / scientific / scientific_name | Species scientific name | YES |
Multiple scientific names can be specified with comma as a separator. e.g. Sightings of Humpback whale and Blue whale This is the same as |
|
| Dataset | dataset_id | Dataset ID | YES |
Multiple Dataset IDs can be specified with comma as a separator. e.g. Dataset "SEFSC Atlantic surveys 1992 (Dataet ID: 3)" This is the same as e.g. Datasets "SEFSC Atlantic surveys 1992 (Dataet ID: 3)" and "SEFSC Caribbean Survey 2000 (Dataset ID: 7)" |
| Temporal | year | A single year or a range of years | YES |
Temporal parameters can be added along with dataset or species parameters. To specify a range of years, add the start year and the end year with comma as a separator. e.g. Humpback whale sightings in Year 2000 e.g. Humpback whale sightings from 2000 through 2003 |
| month / months | Months (numeric) |
YES |
Multiple months can be specified with comma as a separator. e.g. Humpback whale sightings in January and February |
|
| season / seasons | winter / 1; spring / 2; summer / 3; fall / 4 |
YES |
Seasons as string or number can be added as a parameter. Multiple seasons can be specified with comma as a separator. e.g. Humpback whale sightings in summer or fall |
|
| Zone / Region | zone | Zone type [eez|lme|meow];Zone name;Zone ID | NO |
Zone name and ID can be found in the "Select zones" window. e.g. Humpback whale sightings within Australian EEZ |
| region | Zone ID | NO |
Applicable to preloaded region layer. | |
| Layer type | initLayer | points | NA |
By default, the sightings are aggregated by unit cell. If you want to see individual sightings as points (i.e. the points layer), set this parameter. Note the drawing may be slow if there are a lot of sightings (e.g. > 10,000). e.g. Pygmy Sperm Whale with the points layer shown |
| Color by | colorBy | sp_tsn / dataset / series | NA |
For the points layer, specify how the points are color-coded. e.g. Pygmy Sperm Whale with the points layer shown and classified by dataset |
Dataset Page
If you are interested in a particular dataset, the Dataset Page gives you the quickest access to the information and data of the dataset. The Dataset Page loads its data and presents its metadata automatically.
This is convenient if you are a contributor and want to have a direct link to your dataset.
The URL of the Dataset Page is:
https://seamap.env.duke.edu/dataset/dataset_id
where dataset_id is the Dataset ID, a numeric identifier of the dataset, which you will need to know in advance.
If you don't know the Dataset ID, the quickest access to the Dataset Page would be to search the dataset by dataset name or contributor name using the Quick Search on the front page. Once you found your dataset of interest in the dropdown, click the name of the dataset that brings you to the Dataset Page.
Species Profile Page
If you are interested in a particular species, the Species Profile Page gives you the quickest access to the information and data of the species. The Species Profile Page loads its data and presents the species profile compiled by OBIS-SEAMAP automatically.
The URL of the Species Profile Page is:
https://seamap.env.duke.edu/species/itis_tsn
where itis_tsn is a taxonomic serial number organized by the Integrated Taxonomic Information System.
If you don't know the taxonomic serial number of the species, the quickest access to the Species Profile Page would be to search the species by species name (scientific or common) using the Quick Search on the front page.
Once you found your species of interest, click the species name that brings you to the Species Profile Page.
Gridded distribution or points
Gridded distribution
By default, the map displays the rectangular gridded summary of the data extracted and aggregated at a resolution according to the current zoom level. This gives you a quick view of the spatial distribution of the data. The rectangular grids are based on "C-Squares" (Rees 2003). The summary represents one of the following counts or indexes color-coded by that count at a specific resolution with the number of records being default.
- Number of records
- Number of animals (group size)
- Number of species (species richness)
- Shannon Index
- Simpson Index
- Hurlbert's Index
To change the count type, choose one of the six count types listed in the Display Options section in the Map Summary Panel. If the choices are not visible, turn "Summary" on.
In addition to rectangular grids, the aggregation by hexagonal grids is also built using the H3 Hexagonal hierarchical geospatial indexing system. The hexagonal gridded summary changes its resolution more smoothly than the rectangular gridded summary. To display hexagonal grids, choose "Hexagon" from the Grid Type choice.
The grid resolution automatically changes in response to the zoom level as follows. You can aslo fix the resolution by choosing the desired resolution icon for the rectangular grids or enter the H3 index for the hexagonal grids. Then, "Fixed" option will be chosen. To go back to the automatic resolution change, choose "Auto" option.
| Zoom level | 2 | 3 | 4 | 5 | 6 | 7 | 8 | 9 | 10 | 11 | 12 | 13 |
|---|---|---|---|---|---|---|---|---|---|---|---|---|
| Rectangular Resolution (degree) | 1.0 | 0.1 | 0.01 | |||||||||
| Hexagonal Resolution (H3 index) | 3 | 4 | 5 | 6 | 7 | 8 | ||||||
Points layer
The points layer renders individual observation records as points on the map. Since the number of points can be huge (e.g. 100,000 points), it may take a few minutes to map all. You can switch between the gridded summary and the points layer anytime by checking one of them in the Display Options section (you can even show them both). The points layer is not available when no criteria are set up (you can't see all the OBIS-SEAMAP data as points at once as it will take too long), though.
Points are rendered with symbols based on the data type. For example, visual sightings collected from a vessel or airplane survey is rendered with a filled circle. Telemetry locations from a tagged animal are given a triangle. Points are given the same colors per dataset, species or individual animals. You can choose one of them by checking [Species], [Dataset] or [Individual] from [Color by] section. If you chose [Individuals], the observation records that are not identified as an individual (this is usually the case for vessel or airplane visual sightings) are given red.

Charts
You can explore observation data with interactive charts.
For more details, see Charts or see the popup help within the Mapping Tool.
Download data
OBIS-SEAMAP provides flexible and powerful data download features. You can download data in the following formats:
- CSV
- ESRI file geodatabase or shapefile
- Google Earth KML/KMZ
- OGC WMS
- OGC WFS
For more details, see Download OBIS-SEAMAP data or see the popup help within the Mapping Tool.